1
© 2022. School of Government. e University of North Carolina at Chapel Hill.
Mecklenburg County Property Tax
Appeals: A Systemic Bias Analysis
Christopher B. McLaughlin
JULY 2022
Mecklenburg County contracted with the School of Government at the University of North
Carolina, Chapel Hill (the School), to study recent property tax appeal data for evidence of
systemic bias (the Study).
To conduct the Study, the School analyzed residential property tax appeal data related to
Mecklenburg County’s 2019 county-wide reappraisal to determine if appeal rates or appeal
results varied based on two independent variables: property values and a neighborhood’s
minority population percentage. Stated dierently, the Study sought to determine whether
residential property owners in more White or more auent neighborhoods were more likely to
appeal their property tax appraisals and/or more likely to obtain a better result when they did
appeal compared to residential property owners from less White or less auent neighborhoods.
1
e data included both informal appeals, meaning properties for which taxpayers contacted
the tax oce seeking an initial review of their appraisal values, and formal appeals, meaning
properties for which appraisal appeals were heard by the county board of equalization and
review (BOER).
Summary of Results
Appeal Rates—(see Table 1)
e data demonstrated that both informal and formal appeal rates are generally higher for (1)
neighborhoods with larger White populations and (2) neighborhoods with higher value homes.
In other words, taxpayers from neighborhoods with more White residents and those who
owned more expensive homes on average contacted the county tax oce for initial reviews of
their tax appraisals and led formal appeals with the BOER more often than did taxpayers in
neighborhoods with more minority residents and those who owned less expensive homes. e
disparity is greater for informal appeals than for formal appeals, but it is evident in both data
sets.
1. As used in the Study, the term “neighborhood” refers to “block groups” as dened by the United
States Census Bureau. ere were 624 block groups in Mecklenburg County in the 2020 Census. See
Methodology for more details.

2 July 2022
© 2022. School of Government. e University of North Carolina at Chapel Hill.
Table 1. Informal and Formal Appeal Rates (%)
Informal Formal
All Residential Properties 7.10 1.93
Majority White Neighborhoods
a
8.39 2.14
Majority Minority Neighborhoods 5.82 1.70
Low Minority % Neighborhoods
b
9.72 2.31
High Minority % Neighborhoods
c
4.88 1.86
High Value Properties
d
11.71 3.24
Low Value Properties
e
4.05 1.65
a
Based on current data, 285 of Mecklenburg County’s 624 census block groups are majority White and 339 are majority
minority.
b
The Low Minority % Neighborhoods category represents the appeal rate for the 20 percent of residential properties from the
block groups with the lowest minority population percentages. The minority population percentage for these block groups ranged
from 5 to 21 percent.
c
The High Minority % Neighborhoods category represents the appeal rate for the 20 percent of residential properties from
the block groups with the highest minority population percentages. The minority population percentages for these block groups
ranged from 80 to 97 percent.
d
The High Value Properties category represents the appeal rate for the 20 percent of all residential properties with the highest
initial appraised values. The properties in this category ranged in value from $390,101 to $11,745,178.
e
The Low Value Properties category represents the appeal rate for the 20 percent of all residential properties with the lowest
initial appraised values. The properties in this category ranged in value from $0 to $152,300.
Appeal Results—(see Table 2)
Informal appeal results are generally more favorable for (1) taxpayers from neighborhoods with
larger White populations and (2) taxpayers from neighborhoods with higher value homes. In other
words, taxpayers from neighborhoods with more White residents and those who owned more
expensive homes on average obtained larger reductions in their appraised values as a result of
initiating the informal appeal process than did taxpayers in less White neighborhoods and those
who owned less expensive homes.
However, there were no consistent relationships between formal appeal results and
neighborhood minority population percentage or property values. In other words, the data suggest
that taxpayers from neighborhoods with more White residents and those who owned more
expensive homes obtained roughly similar results from BOER appeals as did taxpayers from less
White neighborhoods and those who owned less expensive homes.

Mecklenburg County Property Tax Appeals: A Systemic Bias Analysis 3
© 2022. School of Government. e University of North Carolina at Chapel Hill.
Table 2. Informal and Formal Appeal Results (%)
Informal
a
Formal
a
All Residential Properties 4.1 5.5
Majority White Neighborhoods
b
5.0 5.7
Majority Minority Neighborhoods 2.7 5.7
Low Minority % Neighborhoods
c
6.2 6.2
High Minority % Neighborhoods
d
2.8 6.0
High Value Properties
e
6.9 7.1
Low Value Properties
f
2.5 7.7
a
Measured as a percentage reduction in initial appraised value. For example, the 4.1 percent average informal appeal result for
all informal appeals means that the average informal appeal resulted in a 4.1 percent reduction in appraised value.
b
Based on current data, 285 of Mecklenburg County’s 624 census block groups are majority White and 339 are majority
minority.
c
The Low Minority % Neighborhoods category represents the average appeal result for the 20 percent of appeals from the
block groups with the lowest minority population percentages. The minority population percentage for these block groups ranged
from 5 to 16 percent for informal appeals and from 5 to 23 percent for formal appeals.
d
The High Minority % Neighborhoods category represents the average appeal result for the 20 percent of appeals from the
block groups with the highest minority population percentages. The minority population percentages for these block groups
ranged from 76 to 97 percent for informal appeals and from 82 to 97 percent for formal appeals.
e
The High Value Properties category represents the average appeal result for the 20 percent of appeals with the highest initial
appraised values. The properties in this category ranged in value from $522,301 to $8,562,700 for informal appeals and from
$523,601 to $10,741,400 for formal appeals.
f
The Low Value Properties category represents the average appeal result for the 20 percent of appeals with the lowest initial
appraised values. The properties in this category ranged in value from $20,000 to $181,300 for informal appeals and from $38,000
to $162,800 for formal appeals.
Methodology
e data set provided by Mecklenburg County consisted of 23,022 informal appeals and 6,207
formal appeals
2
out of roughly 321,000 residential property tax parcels
3
in the county.
Because it was impossible to determine the actual race for each of Mecklenburg County’s
residential property owners, the Study instead relied on demographic information from the
United States Census Bureau (the Census) organized by block group.
4
e School located each of
2. Some properties were in both the informal appeal and the formal appeal data sets. Of the 23,022
properties that were the subject of informal appeals in 2019, 1,626 (7 percent) of them were also the
subject of formal appeals in that year. Note that the Study did not look at the substance of any of the
appeals and focused only on their identifying characteristics (address, initial property value, nal
property value).
3. As used in the Study, the term “residential property” includes properties developed with free-
standing homes, multiplex homes, townhomes, and condominiums, regardless of whether the property is
occupied by the owner or a tenant. e term excludes apartment buildings in which all units are owned
by a single party and undeveloped lots.
4. A block group is the smallest geographical unit for which the Census publishes sample demographic
data. In the 2020 Census, there were 239,780 block groups in the United States, 7,111 in North Carolina,
and 624 in Mecklenburg County. See U.S. Census Bureau, 2020 Census Tallies, https://www.census.gov
/geographies/reference-les/time-series/geo/tallies.html#block_by_state. In Mecklenburg County, the
population of these block groups varied widely from less than 100 to more than 4,000.
4 July 2022
© 2022. School of Government. e University of North Carolina at Chapel Hill.
Mecklenburg County’s residential property parcels in one of the county’s 624 block groups.
5
For
each block group, the Census provided minority population percentage. e School could then
calculate an average appeal rate and appeal result for each block group and organize those block
groups based on minority population percentage.
For both independent variables—property value and block group minority population
percentage—the appeals were segmented into ten roughly equal “bins” to enable analysis.
For each bin, average values for each of the dependent variables—appeal rates and appeal
results—were calculated. Scatterplots were then created to determine whether either of those
independent variables had a consistent and material impact on the dependent variables.
6
Detailed Results
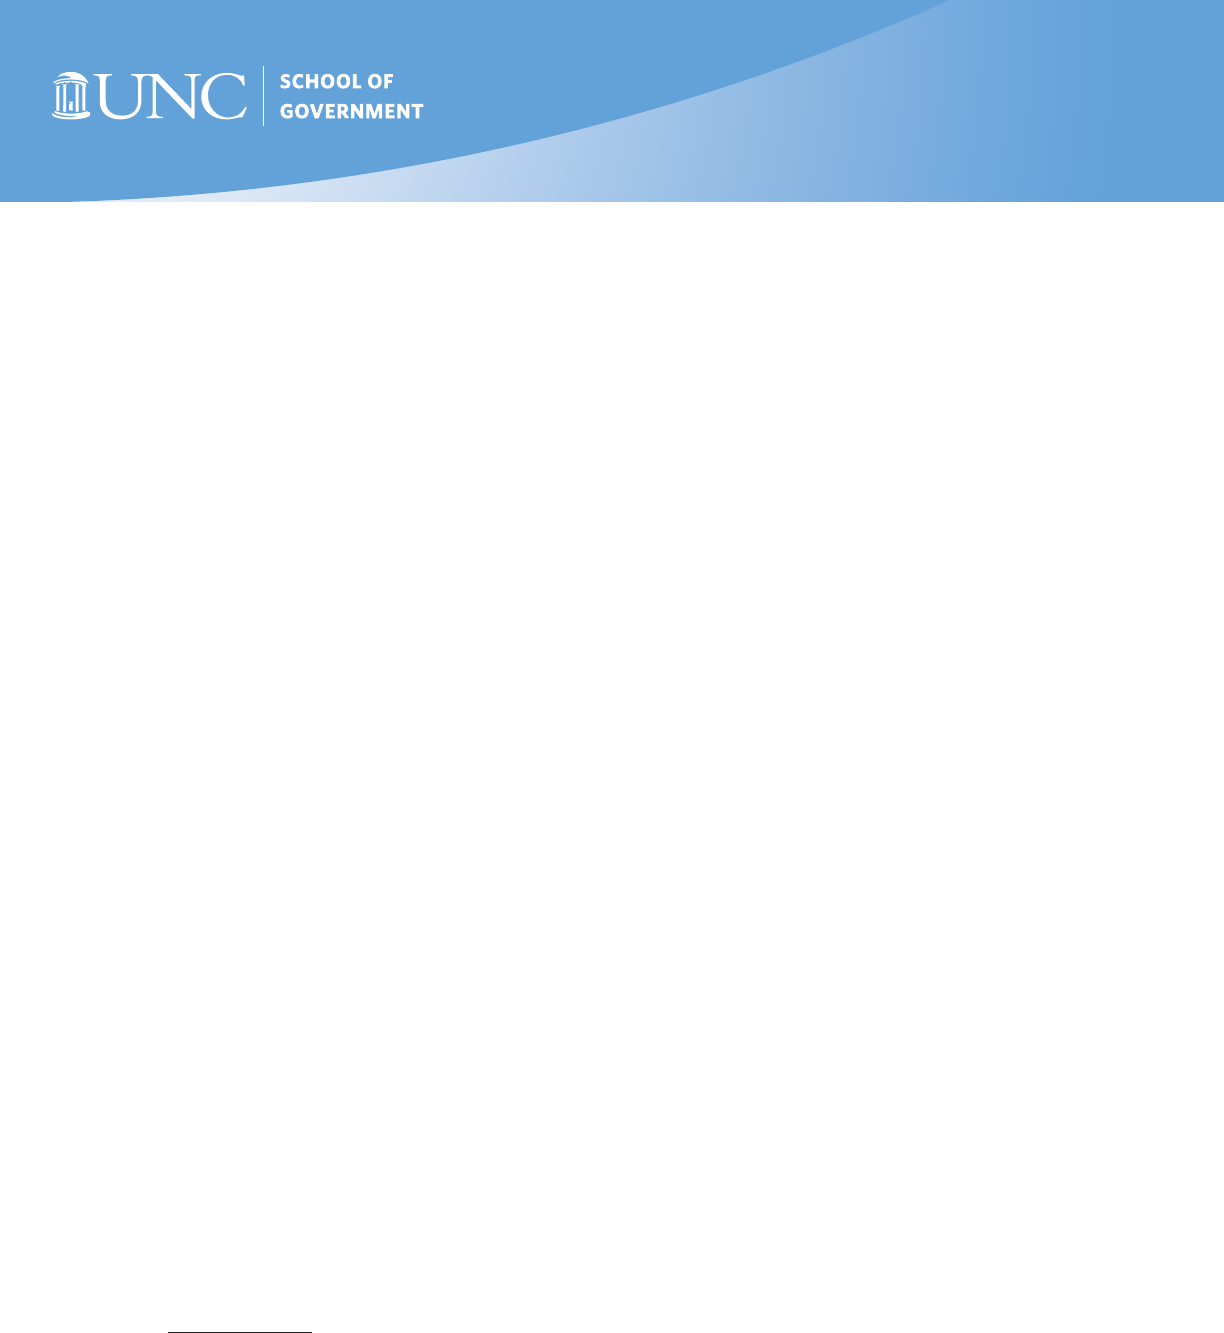
How Did Property Values Aect Appeal Rates?—(see Figure 1)
As property values increased, both informal and formal appeal rates also generally increased.
To analyze the impact of property values on appeal rates, the 321,200 total residential
properties were sorted by property value and separated into ten bins. e rst bin contained the
10 percent of properties with the lowest initial appraised values, the second bin contained the 10
percent of properties with the next lowest initial appraised values, and so on. Each bin contained
roughly 32,120 properties. Average informal and formal appeal rates for each bin were calculated
and graphed.
5. Not every one of the county’s 624 block groups contained residential properties that were included in
the study. Only 602 block groups were represented in the residential property data provided by the county.
6. e majority of the data analysis in the study was conducted by Haki Johnson and James Hamilton,
two graduate students in the UNC-Chapel Hill Department of City and Regional Planning. e author
thanks them for their excellent work.
14
12
10
8
6
4
2
0
0–
120.9
121.0–
152.3
152.4–
177.0
177.1–
202.8
Property Value Range in Thousands of Dollars
Appeal Rate (%)
Figure 1. Appeal Rates by Property Value
202.9–
232.8
232.9–
268.6
268.7–
317.9
318.0–
390.1
390.2–
535.7
535.8–
11,745.1
4.12
3.99
5.10
6.28
6.60
7.0
7.19
7.86
9.74
13.69
3.61
2.87
1.95
1.74
1.37
1.53
1.49
1.41
1.40
1.88
Formal Appeals
Informal Appeals
Mecklenburg County Property Tax Appeals: A Systemic Bias Analysis 5
© 2022. School of Government. e University of North Carolina at Chapel Hill.
9
8
7
6
5
4
3
2
20.0–
146.9
147.0–
181.3
181.4–
211.3
211.4–
244.7
Property Value Range in Thousands of Dollars
Reduction from Appraised Value (%)
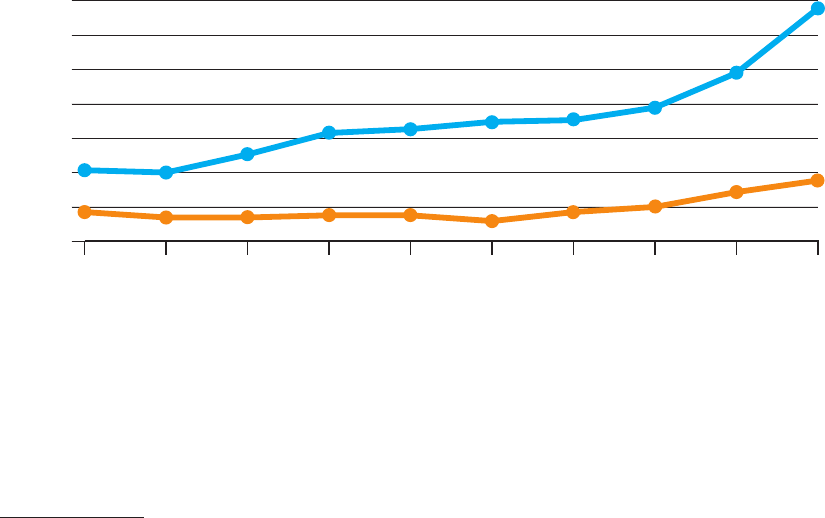
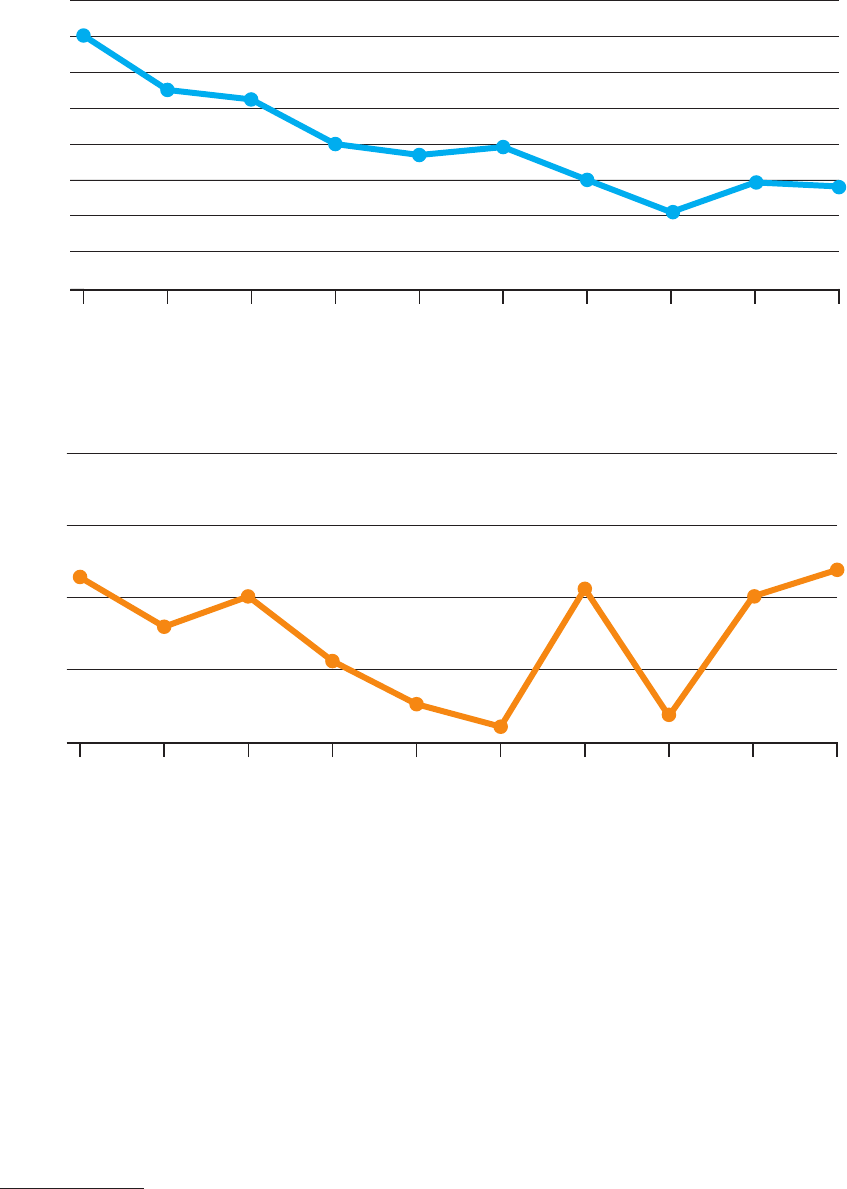
Figure 2. Informal Appeal Results by Property Value
244.8–
286.1
286.2–
338.3
338.4–
411.9
412.0–
522.3
522.4–
763.0
763.1–
8,562.7
2.7
2.4
2.5
2.9
3.3
3.9
4.3
5.3
5.6
8.2
12
10
8
6
4
2
0
38.0–
122.9
123.0–
162.8
162.9–
195.1
195.2–
232.2
Property Value Range in Thousands of Dollars
Reduction from Appraised Value (%)
Figure 3. Formal Appeal Results by Property Value
232.3–
283.3
283.4–
341.0
341.1–
418.3
418.4–
523.6
523.7–
757.3
757.4–
10,741.4
11.8
3.5 3.4
3.7
3.6
3.9
4.9
5.4
6.3
7.9
How Did Property Values Aect Appeal Results?—(see Figures 2 & 3)
As property values increased, the favorability of informal appeal results generally increased as well.
Higher value properties generally obtained better results (meaning larger percentage decreases in
appraised values) than did lower value properties at the informal appeal stage. But property values
did not have a consistent impact on formal appeal results.
To analyze the impact of property values on appeal results, both the informal and formal
appeals were sorted by property value and then separated into ten bins. e rst bin contained
the 10 percent of appeals with the lowest initial appraised values, the second bin contained the
10 percent of appeals with the next lowest initial appraised values, and so on. Each informal
appeal bin contained roughly 2,300 appeals, while each formal appeal bin contained roughly 620
appeals. Average informal and formal appeal results for each bin were calculated and graphed.
6 July 2022
© 2022. School of Government. e University of North Carolina at Chapel Hill.
12
10
8
6
4
2
0
5–14 15–21 22–27 28–37
Minority Population (%)
Appeal Rate (%)
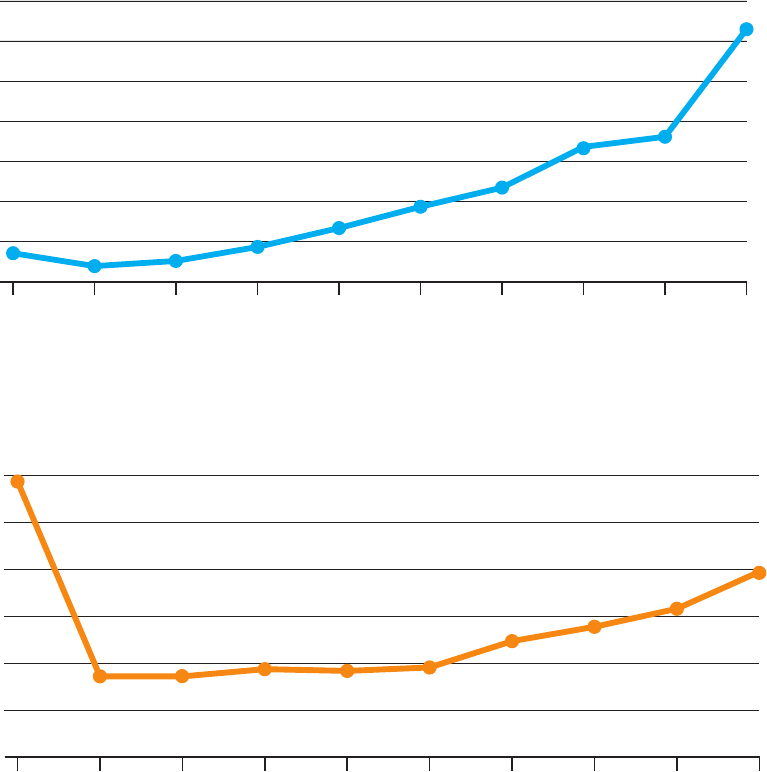
Figure 4. Appeal Rates by Neighborhood Minority Population
38–48 49–62 63–73 74–79 80–85 86–97
2.8
2.0
1.8
2.6
Formal Appeals
Informal Appeals
1.6 1.6 1.6 1.5
2.0
1.7
11.1
8.8
8.2
6.8
7.3
6.8
6.5
5.8
5.6
4.7
How Did Neighborhood Minority Population Percentages Aect Appeal Rates?—(see Figure 4)
As neighborhood minority population percentages increased, informal appeal rates generally
decreased. This relationship was less consistent for formal appeals.
To analyze the impact of neighborhood minority population percentage on appeal rates, each
of the 321,200 residential parcels was associated with the appropriate block group and then
sorted by block group minority population percentage. e properties were then separated into
ten roughly equal bins.
7
e rst bin contained the 10 percent of properties with the lowest block
group minority population percentage, the second bin contained the 10 percent of properties
with the next lowest block group minority population percentage, and so on. Average informal
and formal appeal rates for each bin were calculated and graphed.
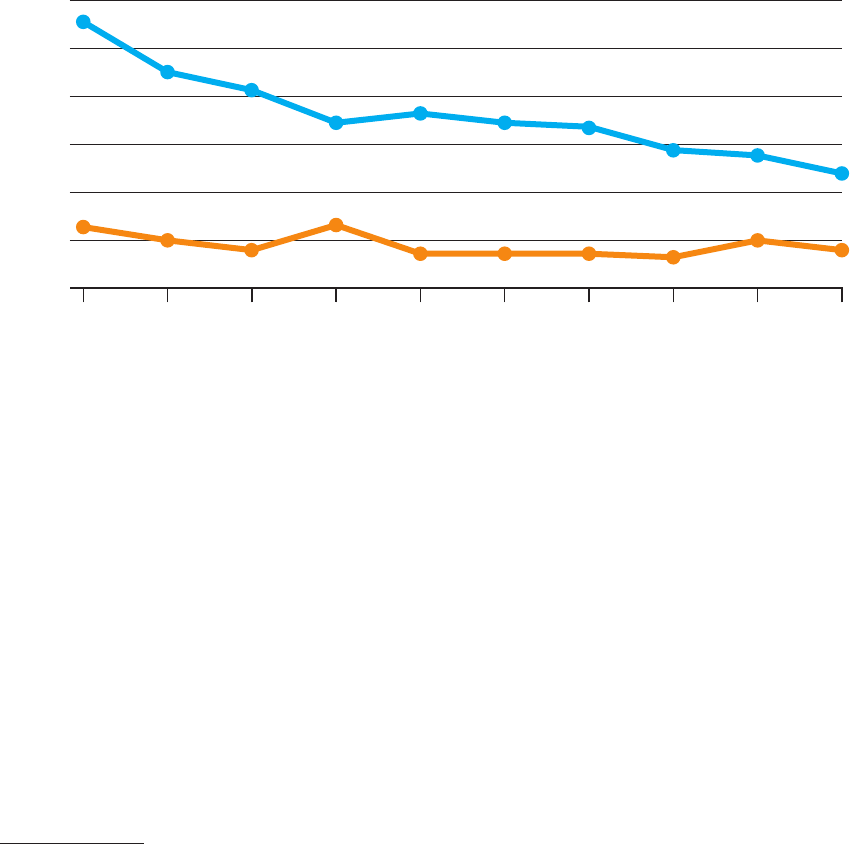
How Did Neighborhood Minority Population Percentages Aect Appeal Results?—(see Figures 5 & 6)
As neighborhood minority population percentages increased, the favorability of informal appeal
results generally decreased. Properties from neighborhoods with higher minority population
percentages generally obtained worse results (meaning smaller percentage decreases in
appraised values) from informal appeals than did properties from more White neighborhoods. But
neighborhood minority population percentages did not have a consistent impact on formal appeal
results.
To analyze the impact of neighborhood minority population percentage on appeal results,
each appeal (both informal and formal) was associated with the appropriate block group and
then sorted by block group minority population percentage. e appeals were then separated
into ten roughly equal bins.
8
e rst bin contained the 10 percent of appeals with the lowest
block group minority population percentage, the second bin contained the 10 percent of appeals
with the next lowest block group minority population percentage, and so on. Average informal
and formal appeal results for each bin were calculated and graphed.
7. e bins were not exactly equal in size due to the need to avoid dividing block groups between bins.
8. See note 7.
Mecklenburg County Property Tax Appeals: A Systemic Bias Analysis 7
© 2022. School of Government. e University of North Carolina at Chapel Hill.
Conclusion
What do these results mean for the Mecklenburg County tax oce and its practices going
forward?
First, it may be helpful to put the Study’s results in context. e Study’s results were
comparable to those of a recent similar study conducted with appeal data from Durham County.
9
e appeal data from both counties showed higher appeal rates for neighborhoods with larger
White populations and with more expensive homes. Neither county’s data demonstrated a
consistent relationship between neighborhood minority percentage or property value and the
results of formal appeals. e primary dierence between the two studies was that Mecklenburg
County’s informal appeal results were aected by both neighborhood minority population
9. For the results of my Durham County study, see Analyzing Property Tax Appeals for Systemic Bias,
Coates’ Canons: NC Local Government Law, UNC School of Government Blog (October 4, 2021), ht tps://
canons.sog.unc.edu/2021/10/analyzing-property-tax-appeals-for-systemic-bias/.
8
7
6
5
4
3
2
1
0
5–12 13–16 17–22 23–28
Block Group Minority Population (%)
% Reduction from Appraised Value
Figure 5. Informal Appeal Results by Neighborhood Minority Population
29–37 38–49 50–62 63–75 76–82 83–97
7.0
5.4
5.2
5.0
3.7
3.9
3.0
2.1
2.9
2.8
8
7
6
5
4
5–15 16–23 24–31 32–41
Block Group Minority Population (%)
% Reduction from Appraised Value
Figure 6. Formal Appeal Results by Neighborhood Minority Population
42–53 54–66 67–76 77–81 82–87 88–97
6.3
5.6
6.0
5.1
4.5
4.2
6.1
4.4
6.0
6.4

8 July 2022
© 2022. School of Government. e University of North Carolina at Chapel Hill.
percentage and property value; Whiter neighborhoods and more valuable properties generally
obtained better informal appeal results than did less White neighborhoods and less valuable
properties.
10
Second, consider that lower appeal rates and worse informal appeal results among taxpayers
who live in minority neighborhoods and those who own less expensive homes may contribute to
a “property tax assessment gap” that benets Whiter, more expensive neighborhoods.
is assessment gap is the gap between the ratio of tax assessments to sales prices for Black-
owned property as compared to that same ratio for non-Black-owned property. One national
study concluded that the assessment gap in North Carolina was 11 percent. In other words,
Black-owned properties in North Carolina were assessed about 11 percent higher than White-
owned properties compared to actual sales prices. is result places North Carolina just below
the study’s national average assessment gap of 12.7 percent but in the highest third overall.
11
Most appeals produce reductions in assessed values.
12
If taxpayers owning less expensive
homes and living in majority minority neighborhoods are less likely to appeal their tax
appraisals, it follows that the property owned by those taxpayers on average would be assessed
higher relative to market value than property owned by other taxpayers.
e lower appeal rates for certain groups of taxpayers may occur in part due to a lack of
education and information about the property tax appeal process. Additional outreach by
the tax oce targeting minority and less auent neighborhoods might alleviate some of that
information decit. Taxpayers may be more likely to take advantage of the property tax appeal
process if they learn that the process is free, does not require an attorney, and generally does not
involve a home inspection.
ird, the Study shows no evidence of systemic bias in formal appeal results based on
property values or a taxpayer’s race. Appeal hearings before the county BOER are held in person,
meaning the race of the taxpayer would be apparent to the tax oce and to the board. If these
decision-makers were biased against minority taxpayers, one would assume that bias would
reveal itself in appeal results that vary by the race of the appealing taxpayer. e Study nds no
evidence of racially biased appeal results in decisions issued by the Mecklenburg County Board
of Equalization and Review.
Fourth, the county may wish to investigate why the results of informal appeals—
meaning emails and phone calls by taxpayers to the tax oce—appeared to vary based on
neighborhood minority population percentage and property value. Why did taxpayers from
Whiter neighborhoods and those who owned more expensive properties tend to obtain larger
reductions in assessed values than did taxpayers from less White neighborhoods and those who
owned less expensive properties? Do taxpayers from minority neighborhoods and less wealthy
neighborhoods not have the same access to the information necessary to prove their assessments
were too high? Is more outreach and support required for these neighborhoods? Does the tax
oce need to take additional steps to help taxpayers unfamiliar with the appeal process gather
and submit the appropriate information to support their appeal? e Study does not answer
those questions, but it does shed light on a problem that may need more attention.
10. Durham County did not provide data on its informal appeals, meaning it is impossible to determine
if Durham County’s informal appeal results were impacted by neighborhood minority population
percentage or property value to the same extent as were Mecklenburg County’s informal appeal results.
11. For more about the assessment gap, see my post, Systemic Bias and Property Taxes, Coates’ Canons:
NC Local Government Law, UNC School of Government Blog (November 23, 2020), https://canons.sog
.unc.edu/systemic-bias-and-property-taxes.
12. Just over 50 percent of both the informal and formal appeals included in the Study resulted in
reductions in assessed values.
