Are North Carolina Property Taxes Fair and Equitable?
By Hudson Vaughan
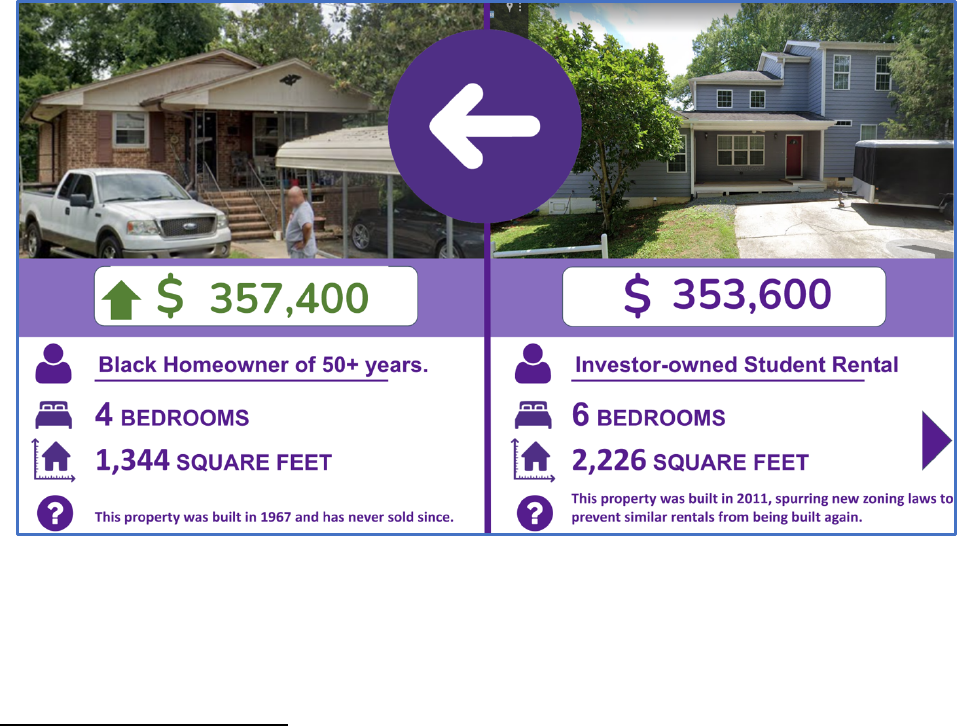
Ms. Morris, a 95-year-old lifetime resident in a historically Black neighborhood in a North
Carolina town, received her new property tax valuation in the mail. The value had jumped from
$190,000 to over $350,000, an ~85% increase. She knew this could mean her property taxes
would almost certainly increase substantially
1
, and she’d have to reach deeper into limited
retirement to hold onto the home her family built and she’d spent decades maintaining. But,
while she was worried about this rise, she assumed, as did most of her neighbors, that this was
just the reality of the market, an unfortunate but accurate assessment of its tax value.
Just down the street, in the same neighborhood, a 6-bedroom investor-owned student rental
built 50 years after Ms. Morris’ house and nearly twice its size, received a lower valuation than
her house.
2
Several of the recently built student rental properties had, in fact, received tax
assessed values hundreds of thousands of dollars less than their recent sale prices, even while
the valuations of older homes like Ms. Morris’ nearly doubled.
Months of collective community advocacy followed. Neighbors built a coalition of a dozen local
organizations, submitted over a hundred individual appeals, sent letters to the commissioners
signed by over 600 county residents, and created visuals like the above to demonstrate the
inequities. The county finally recognized that hundreds of neighborhood properties, mostly
1
While a rise in assessed value does not necessarily entail an increase in property taxes, given the property taxes
will be determined by the city/county tax rates in relation to the revaluation county wide, an individual valuation
increase of this amount, coupled with substantially less increase elsewhere in the county, would almost certainly
lead to a substantial property tax increase for neighbors like Ms. Morris.
2
The image above shows the two properties and their initial tax values. The investor-owner of the house on the
right still filed an informal appeal, and the county appraisers lowered his home’s value by ~$10,000.

2
older homes owned by Black, long-term residents, had been systemically over-valued – and
reassessed the entire neighborhood. Property value increases were cut in half as a result.
What happened that led to such systemic inequity? Was this just a rare mistake or the work of
a problematic assessor?
It turns out the property valuation inequities in this case were not the result of purposeful
discrimination, individual mistake, or assessment malpractice but a systemic error following an
approach to mass assessment common across the country that lends itself to inequity.
3
The
county had, in fact, met basic sales ratio requirements and matched neighborhood averages to
qualified comparable sales. But things had still somehow gone awry.
There was not one easily identified problem, but several issues came to light in the process. 1)
Attention hadn’t been paid to the variations of the neighborhood’s zoning restrictions and
limitations. Houses built in the 1920’s without major renovations were being compared to
much bigger homes built or renovated in the last twenty years.
4
3) Neighborhood delineations,
which help determine land values, combined disparate property ages and types and yet divided
up the community in ways that separated off relevant sales that showed the range of the
housing market. As a result, land values had been set for properties at higher amounts than
some of the neighborhood home sales, even arms-length sales in which the property value was
clearly more than just the land itself. 4) Data on many homes was inaccurate, especially on
investor homes featuring work completed without permits.
5
5) Averages and medians across
widespread values had been over-utilized, squeezing assessed values to the middle. 6) Appeals
from low-wealth historically Black neighborhoods like this one tend to be less likely
6
, which may
have contributed to the lack of recognition to the detailed differences within the community.
In other words, elements in every part of the mass appraisal system contributed.
Property tax values rarely command the public’s attention. Revaluations are spread out to
every four to eight years in NC counties, and most homeowners tend to trust that assessments
are relatively fair and reflective of the market (or even lagging it). If there are mistakes, we
assume they are idiosyncratic— a miscalculation on a single property. On an individual level,
property taxes can seem somewhat insignificant, folded into our mortgage escrow payments or
a one-time annual expense. And if our property taxes are high across our neighborhood, we
likely blame the tax rate, instead of questioning the tax value and the distribution of tax burden
within our communities.
3
Christopher Berry, “Reassessing the Property Tax,” The University of Chicago: The Harris School of Public Policy
and the College (March 1, 2021), Accessed at https://bpb-us-
w2.wpmucdn.com/voices.uchicago.edu/dist/6/2330/files/2019/04/Berry-Reassessing-the-Property-Tax-3121.pdf
4
Many of these larger homes were built just before new neighborhood zoning restrictions that no longer allow
such large homes in the community, so the older homes cannot be redeveloped into similar sized rentals.
5
Many of these renovations could be seen in rental postings online
6
Chris McClaughlin, “Analyzing Property Tax Appeals for Systemic Bias,” Coates-Canon NC Local Government Law
Blog (October 4, 2021), Accessed at https://canons.sog.unc.edu/2021/10/analyzing-property-tax-appeals-for-
systemic-bias/.
3
But what about when there are broad-based problems in the tax assessments throughout our
communities, as many national studies have shown?
7
After all, a large majority of county and
local government funding comes from property taxes, so while the individual burden may seem
limited, the collective impact of an unfair and inequitable property valuation could be massive.
In the example above alone, had neighbors not recognized the systemic problem and
advocated for the county to correct it, it’s likely that long-term, lower income Black neighbors
would have paid nearly $1,000,000 more collectively in property taxes before the next
reassessment. Imagine the impact on tens of thousands of homeowners like Ms. Morris if this
example reflects a more systemic problem across the state.
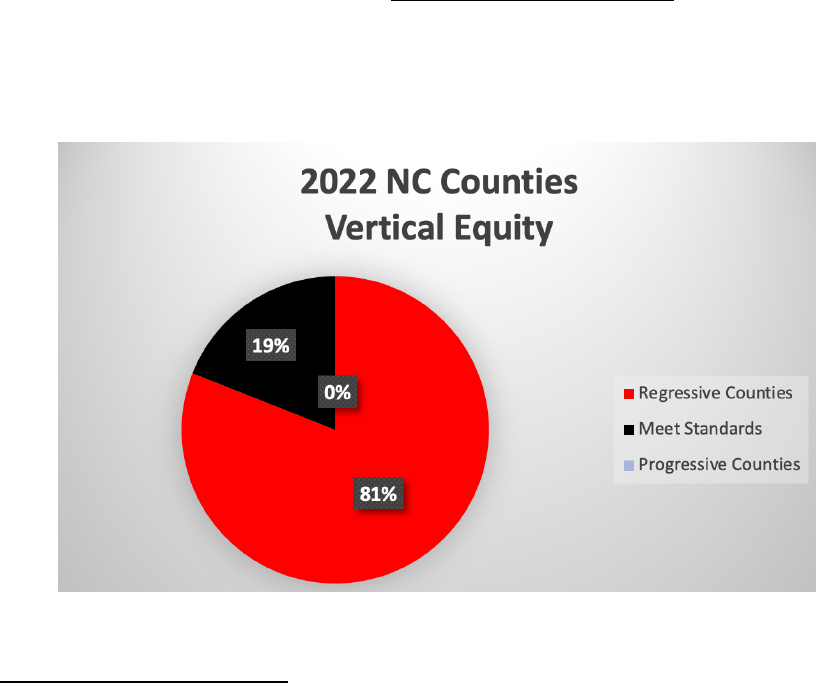
As it turns out, the problem exceeds what I imagined. In 2022, 81 of 100 NC Counties were
considered regressive, failing to meet basic vertical equity standards for county-wide data
samples.
8
This means that in more than 4 out of 5 counties statewide, higher-value properties
are underassessed while lower-value property is over-assessed in comparison beyond the
acceptable range of error, functionally leading to a higher property tax burden for low-income
homeowners and communities throughout the state, often to an even more extreme degree
than in the case of Ms. Morris.
9
7
See Avenancio-León and Howard’s “The Assessment Gap: Racial Inequalities in Property Taxation,” and Berry’s
“Reassessing the Property Tax” as two of the more prominent recent analyses.
8
Analysis of North Carolina’s statewide 2022 random sample of qualified sales (2021 sales). 81 of 100 counties
had a Price Related Differential of 1.03 or greater. The median PRD was 1.08, far outside the bounds of the IAAO
standard of 0.98-1.03. The random sample includes ~30,000 qualified sales statewide. It represents a smaller
proportion of larger county sales, but is a substantial portion, if not all, of many smaller county qualified sales.
9
In fact, the neighborhood example in the introduction of this article is located in one of the 19 counties that
meets the standards, demonstrating just how serious this disparity may be in many of these other counties.

4
2022 was not an anomaly either. From 2019-2022, an average of 72 counties failed basic
vertical equity standards each year, and all of these were regressive. In fact, not one single
county was considered “progressive” in any of the years, meaning that not a single county
systemically over-assessed high value properties outside of the standard range.
In dozens of NC counties, the very lowest value homes have average sales ratios that are more
than double the sales ratios of the highest value houses. In several counties, average sales
ratios of low-value homes are as much as 4 times higher.
10
To translate this: our state’s lowest
income homeowners in dozens of counties likely pay more than twice as much in property
taxes per dollar of market value than their wealthiest neighbors year after year.
In smaller, racially diverse counties in NC, these vertical inequities often translate directly into
racial inequities given historic property trends. In Northampton, for example, properties in
census block groups that have the highest minority populations have sales ratios that are, on
average, 30% higher than the lowest minority census blocks, a difference nearly equal to the
disparity between the sales ratios in high and low quartile sales prices. In Alamance County,
nearly all of the most racially diverse census block groups have median home prices in the
bottom quartile of values – meaning that when lower value property is overvalued, Black and
Brown communities experience the greatest impact of this inequity, even if there is no direct
racial bias.
10
Using the 95/5 metric which compares average sales ratios in the top and bottom decile of sale values.

5
Even beyond complex issues of vertical and racial equity, most NC counties do not meet basic
standards of fairness and accuracy.
11
One of the most commonly used standards for accuracy
and horizontal equity is the coefficient of dispersion (COD), which assesses the average
deviation of individual property sales ratios from the overall median sales ratio.
12
Mass
assessments are assumed to have some variation from market sales given they are predictions
of value, so the general standards are a COD of 5-15% with county-wide data, with up to 20%
deemed acceptable, especially in more rural counties and with varying property types. For NC,
the average county COD for the hundred counties statewide was 27%, nearly twice the best
practice standard. This means that across the state of North Carolina, the margin of error for
properties in the same county averages nearly 30%!
In a state that demands “all property, real and personal, shall be assessed for taxation at its
true value or use value,” how are such inequities possible?
13
And what can be done to
correct these widespread problems?
When I first started doing property tax research a year ago, I thought the primary answer to this
would come from technical statistical analysis. And this was not entirely wrong: mass
assessment is incredibly complex; national research has shown ways statistical analysis can be
used to identify and correct elements of inequity; and counties that have specialized capacity
and priority for equity seem to be more successful at producing more fair and equitable
assessments.
14
But it turns out there are basic structural issues that lead to unfair property
valuations – and that seem in need of repair even to be able to harness the technical tools. And
these structural issues are not caused by individual assessors or staff members; in fact, most of
the assessors and tax officials I interviewed are going above and beyond the call of duty to
improve their county assessments. The problem is much deeper than this.
As I’ve sought out and analyzed county and state data, talked to county assessors, NC DOR
staff, UNC’s School of Government, and the International Association of Assessing Officers
(IAAO), it has become clear that North Carolina’s state policies and infrastructure are not
currently adequate to support property tax equity and fairness. This is apparent in its basic
property assessment policies, in its lack of infrastructure and capacity to support low-resource
counties, in its data collection and lack of oversight for county assessments, and in its limited
educational requirements for assessors and lack of commitments to access to property tax
equity trainings.
11
More than 60% have a COD higher than 30, and less 1 in 4 meet the 5-15% threshold.
12
In its “Standard on Ratio Studies,” the IAAO defines COD as: “The most generally useful measure of variability or
uniformity is the COD. The COD measures the average percentage deviation of the ratios from the median ratio.”
13
NC Machinery Act: § 105-284: A.
14
In the University of Chicago’s Property Tax Fairness County Reports, NC’s larger counties are less regressive
collectively than its smaller, rural counties. Reports from the Lincoln Land Institute, the national studies previously
mentioned, and reports like the Kirwan Institute’s “Franklin County Auditor Report” all provide extensive analysis,
insights, and recommendations for improved equity and best practices.

6
Here are five recommendations for addressing the most critical structural issues identified
through this research, which included meetings, interviews, and exchanges with assessors
spread across NC and experts involved at all levels of implementing our tax assessments.
15
1) Increase state accountability and oversight for fair and equitable property
assessments: The Department of Revenue, which provides oversight for county
property taxation, performs its statutory duties well.
16
But its role – and its capacity for
oversight and accountability – are far too limited. While many states have enough staff
with appraisal expertise to oversee geographical regions in their states, support
counties with their reassessments, or even perform sales ratio studies themselves,
17
North Carolina law provides a much more limited function for NC DOR, with only a few
staff members overseeing property taxation and even then, in limited ways.
18
For
example, one of the roles of the NC Department of Revenue is collecting annual random
qualified property sales samples from all 100 NC Counties. These samples help produce
a basic sales ratio study each year and for some counties, provide the only impetus for
gathering qualified sales data.
19
This information could be utilized to look at or monitor
broad county-wide property assessment equity trends. But NC’s purpose for this study
is not to monitor county assessments for fairness and equity. NCDOR is simply looking
at whether county median sales ratios are too high or too low in order to adjust public
utility assessed values to those trends, or to “equalize” the public utility assessed values
each year.
20
In fact, NCDOR has very little power in its oversight function. In the smaller counties,
even if their ratios fall far below the standards and their CODs are three times what’s
acceptable, there is no recourse.
21
If one of the larger county’s
22
median sales ratios get
outside of the acceptable range (85-115), then that will trigger “mandatory
advancement,” meaning NCDOR will demand that county moves their next
reassessment up to within the next three years. But most larger counties already
perform reassessments every four years, so this is rarely relevant. It also relies solely on
15
None of these conversations was intended to elicit structural policy issues. And not a single interviewee spoke
negatively about any players. Most found that NC DOR did exactly what it was set up to do, and even went beyond
its required duties when counties asked for support.
16
According to the range of property tax assessors and property tax professionals I spoke with.
17
For example, in Tennessee, state agencies are tasked and staffed to perform appraisal ratio studies on all
properties in all counties at least every two years (including sales verification and data analysis). These ratio
studies are used in a variety of ways, including updates/adjustments of values in counties that fall outside of the
acceptable range. No state or local agency in North Carolina has such a charge or the funding to support it. (
https://comptroller.tn.gov/content/dam/cot/pa/documents/manualsandreports/real-estate-appraisal-ratio-
reports/TaxYear2023AppraisalRatioStudyReport.pdf)
18
Conversations with IAAO staff and NC School of Government professors, spring 2023
19
Chris McClaughlin, "Sales Assessment Ratios Plummet," Coates-Canon Blog (May 17, 2022), Accessed at:
https://www.sog.unc.edu/blogs/coates-canons/sales-assessment-ratios-plummet.
20
Machinery Act, 105-284
21
Supposedly the state will send “strongly worded and encouraging letters” to smaller counties according to
several county assessors.
22
Population of 75,000 or more.

7
the county’s median sales ratios and does not consider other data problems – like the
distribution of the property tax burden within a county or the failures to meet
internationally accepted standards.
Functionally, NC DOR has no structural monitoring function for property tax fairness or
equity. One assessor summed this up well, noting that NCDOR is “more like a big
brother than a parent; the staff there will try to help you out if they can, but you are
largely on your own.”
23
The state also has a Property Tax Commission, but it is set up to
respond to property tax appeals of the first round appeal decisions by county boards of
equalization and has no proactive oversight responsibilities.
24
In the “Report on Nation-Wide Property Tax Regressivity,” Arizona was the least
regressive state in its overall findings (pre-2019).
25
During that period, the state had
several structures of additional support and oversight: a Property Tax Oversight
Commission charged with providing a “continuing review of practices for ensuring a fair
and equitable administration of property tax laws” with the power to call for county
corrections annually; a County Board of Supervisors that provided support and
accountability to county assessors and acted as the Board of Equalization for smaller
counties without significant capacity; and a larger role for their Department of Revenue,
including equalization not just for utilities but also “among counties, classes of property,
and geographic areas.”
26
Structured accountability, it seems, can work.
2) Reduce the length between county revaluations: An eight-year assessment cycle does
not promote fair and equitable property tax distributions (or even a four-year cycle in
strong housing markets). The counties with the highest degrees of vertical and
horizontal inequity are nearly all counties without recent reassessments.
27
The housing
market changes a lot over the course of eight years, even in rural counties. Infrequent
reassessments tend to benefit property owners with rapidly rising values, as their
market values rise each year while their assessed value remains the same until a
reassessment year. Meanwhile, property owners with more stagnant values end up
carrying the heavier burden of taxes. It should not be a surprise that this heavier burden
most often falls on lower-income and minority communities.
It makes sense that the state limits the burden on low capacity and low budget rural
counties by requiring less frequent revaluations. But by having them so infrequently,
neither the state nor the counties invest in the needed infrastructure to maintain data
23
Assessor Interview 2, October 2022.
24
https://www.ncdor.gov/taxes-forms/property-tax/property-tax-commission-frequently-asked-questions
25
The Center for Municipal Finance, “A Report on Nationwide Property Tax Regressivity,” Accessed at:
https://s3.us-east-2.amazonaws.com/propertytaxdata.uchicago.edu/core_logic_nationwide.html.
26
https://azdor.gov/sites/default/files/media/PROPERTY_OverviewAZPTSystem.pdf
27
In 2022, the 20 counties with the highest measures of vertical and horizontal inequity had their revaluations over
4 years ago on average. The 20 counties with the lowest county-wide inequities had revaluations just 1.5 years
ago on average.

8
and oversee equitable assessments. And, as unpopular as reassessments are with the
general public, the states that the IAAO staff highlighted to me as having equitable
property tax systems, as well as the half dozen states with the least regressivity in the
University of Chicago Property Tax Fairness Study, all have one thing in common: more
frequent reassessment periods. As a recent study on racial equity showed, more
frequent reassessments by themselves are not a silver bullet for more equitable
assessments,
28
but they do seem to be a common denominator among less regressive
states.
3) Increase resources and support for all counties to improve their data quality and
maintain consistent data infrastructure necessary to perform equity analysis: Without
state support and accountability and with such infrequent reassessments, there’s little
impetus for counties to invest precious resources and capacity in data quality. It’s hard
to work towards fair and equitable property assessments if a county does not have
accurate data on which to base their reassessments. The residential reassessments rely
on extensive qualified comparable sales data, detailed property information for tens of
thousands of properties, and knowledge of local neighborhoods, zoning differences, and
housing market trends. In the process of this research, I reached out to several smaller,
rural counties in search of basic data that is necessary for mass assessments: complete
qualified sales data and internal sales ratios studies, for example. Many smaller counties
do not even keep qualified sales data beyond what they are required to submit to the
state.
29
Several other counties have had multiple assessors in just the last few years or
have their tax assessor seat vacant altogether, and simply referred me back to the
state’s data. But many of these small counties submit data to the state with
inconsistent PIN numbers that are not compatible with geographic analysis, making it
hard to use the state data for in-depth analysis. This data needs oversight and support
to ensure its consistency and usefulness.
In the end, many of these smaller counties do not have the capacity to do their own
reassessments. Without support from the state, they hire private firms. This is not
inherently a bad move, but if they don’t have the budget to afford one of the more
recognized firms or the capacity to hire one of the few reputable firms years in advance,
they may end up hiring a private firm that does not take the time or resources to visit,
measure properties, ensure accurate information, or have the experience to analyze the
intricacies of the local market.
30
The state provides no support or oversight to ensure
these private firms perform equitable assessments, and the counties don’t have the
internal support to maintain basic quality data standards, much less assess internal
equity issues.
28
Carlos F Avenancio-León and Troup Howard, “The Assessment Gap: Racial Inequalities in Property Taxation,”
The Quarterly Journal of Economics, Volume 137, Issue 3 (August 2022), 1383-1434. See page 1431.
29
Assessor exchanges with 3 NC Counties.
30
Assessor Interview 4, April, 2023.

9
Meanwhile medium size counties with committed assessors are scrambling to clean up
decades of poor data. Several indicated that they inherited data in such a mess that
they could not find the basic qualified sales data within the next several months despite
working constantly to fix their data problems. Others shared data showing recording
errors on dozens of properties or sent data sets designating properties as qualified
without any deeds research. “Data quality is our greatest challenge,” one said.
The fact that NC does not allow tax assessors the right of entry, meaning assessors are
not able to see the insides of properties unless invited to do so, presents additional
difficulties for assessors. As a result, correcting information errors made decades earlier
is especially challenging. One medium-sized county assessor shared that when he
started to work for his county, it was clear that previous appraisers had not even visited
poorer neighborhoods, as house sizes seemed to be entirely made up or guessed.
31
There were no neighborhood delineations in this same county when their assessor
started the year of a reassessment, so the staff had to scramble to create neighborhood
boundaries, admitting his staff did not have time to do them with in-depth engagement.
Again, in none of these cases did the counties have capacity support or oversight from
the state. These functions—measuring properties, correcting data errors, researching
deeds, adding neighborhood delineations— take extensive time and resources that
many counties do not have. And they precede the ability to truly analyze data and
perform more advanced sales ratio equity studies in the first place.
Some assessors in NC have gone above and beyond what’s required. In Henderson
County, the assessor has committed to re-measuring and photographing all 70,000+
properties between each re-assessment, noting changes and keeping the data in
consistent formats so that it can be analyzed and assessed more accurately.
32
In
Durham County, the assessor team engages in extensive community engagement
meetings as they seek to improve their neighborhood delineations and better
understand local markets. They also perform detailed equity analysis by strata,
including using census race and income data to further their inputs.
33
Durham is also a
partner in the Durham Neighborhood Compass
34
, an advanced data and mapping
platform that makes equity analysis much more accessible to the broader community.
These efforts seem to show improvements, especially in eliminating broad patterns of
inequity. These kind of efforts and analysis should be required and supported at the
state level, not just seen as exceptional practices. But support for smaller counties to
build basic infrastructure must undergird this.
31
Assessor Interview 3, November 2022.
32
Example provided by UNC School of Government professor, April 2023.
33
Assessor Interview 1, October 2022.
34
https://compass.durhamnc.gov/en/

10
4) Update and expand NC’s outdated Homestead Exemption program to follow national
best practices: NC’s Homestead Exemption cuts tax assessed value by $25,000 or 50%,
whichever is more, for homeowners who qualify, but it is strictly limited by
age/disability and a specific state-set low-income amount. The income amount requires
extensive verification and administration, making it hard to access; yet is also not
adjusted for things like household size or county income levels, making it more limited
than it should be. At the least, it should be expanded and simplified to reach more low-
income homeowners more easily. But recent studies have also shown how significant
Homestead Exemption programs can be at creating more fair and equitable taxation,
especially programs that provide a flat dollar amount exemption to all or a broad
category of homeowners in addition to more specific-income targeted programs.
In several states, tiered and broad-based Homestead Exemptions have led to more
progressive distribution of property taxes – and in ways that still provide benefit to all
residents who live in a place.
35
In Alaska, the first $150,000 of property value is exempt
for all senior residents’ primary homes. In Boston, the first $295,000 of a primary
residence is exempt from property taxes for all residents. In Chicago, a threshold of just
$30,000 of exempt property tax value was enough to begin to undercut assessment
inequities
36
, especially when paired with additional elderly and low-income exemptions.
These are effective because they address a central mass assessment problem: lower
value properties are inherently harder to assess, not only because of a lack of good data
but because smaller mistakes have larger implications. And rising taxes can lead to
displacement of long-term residents, undermining the fabric of local communities.
Automatically applied homestead exemptions for long-term homeowners, especially if
paired with an updated version of NC’s existing exemption, could go a long way to
correct the unfairness currently in the system. North Carolina should revisit and expand
its Homestead Exemption programs given the wealth of recent studies into their
success.
5) Make courses, trainings, and reviews in assessment equity required —or at least
accessible— for all county assessors. While there are plenty of resources for best
practices in conducting sales ratio studies and improving assessment fairness and
equity—and these resources are critical for understanding and correcting the complex
inequities of mass assessment— these resources are not readily accessible in North
Carolina. North Carolina does not require any of the IAAO trainings or courses for
assessors and appraisers that focus specifically on fairness and equity.
37
Furthermore,
35
Recent studies show the importance of expanded Homestead Exemption policies to equitable taxation, and
while NC has a basic Homestead Program, it is outdated compared to programs reviewed in this research:
https://www.lincolninst.edu/publications/articles/simple-policy-tool-can-make-property-taxes-fairer-ease-
homeowner-hardship
36
Jon Gorey, “This Simple Tool Can Make Property Taxes Fairer and Ease Homeowner Hardship,” Lincoln Land
Institute Online (Dec 2022), accessed at https://www.lincolninst.edu/publications/articles/simple-policy-tool-can-
make-property-taxes-fairer-ease-homeowner-hardship
37
https://www.ncdor.gov/taxes-forms/property-tax/county-assessor-and-appraiser-certifications

11
these courses are expensive and often inaccessible for the smaller-budget counties, so it
is unlikely many of the counties that need these resources the most are going to choose
to spend valuable resources on an optional training program.
In some states, assessors can take IAAO trainings for free, and in other states, property
tax equity trainings and sales ratio studies are required or conducted by the states
themselves.
38
North Carolina has strong educational resource for assessors in the UNC
School of Government, which provides training and guidance for county assessors
statewide. But the state does not provide the kind of resources to UNC’s School of
Government or directly to county assessors to subsidize the costs of equity trainings or
to help conduct sales ratio studies. This could be an easy fix given the strength of NC’s
educational infrastructure and the School of Government’s stellar reputation with the
many assessors with whom I spoke.
County property assessments are prone to inequity without intervention at all levels of our
system. The charge for assessors to value properties fairly and equitably is incredibly difficult
even when they have the proper data and capacity — and when oversight and support for
ensuring this is present at the county and state levels. This paper has sought to identify ways in
which North Carolina’s property tax infrastructure and policies contribute to its systemic
inequities and to offer a few models for change.
This paper has homed in on several recommendations: 1) more state accountability and
support for equitable property taxation; 2) resources and oversight for all counties to improve
and maintain data infrastructure to perform equity analysis, 3) more frequent reassessments or
at least intervals for correction of unfair burdens, 4) a revamped and expanded Homestead
Exemption to undercut the inequities, and 5) required equitable assessment trainings that are
accessible to all assessors.
We live in a state in which all property is supposed to be treated equally for tax purposes. Yet,
hundreds of thousands of low-income residents—and whole communities of color – across the
state of North Carolina are paying far more than their fair share of property taxes. People in
communities like Ms. Morris’ will lose millions of dollars of essential funds to subsidize the
wealthiest property owners, many of whom do not even live in our state. How will we, as a
state and as a public, respond?
38
Interviews and email exchanges with IAAO staff and UNC School of Government professors, April 2023.
