JOHN CHIANG
CALIFORNIA STATE TREASURER
CALIFORNIA BONDS: 101
A Citizen’s Guide to
General Obligation
Bonds
2016 EDITION
1
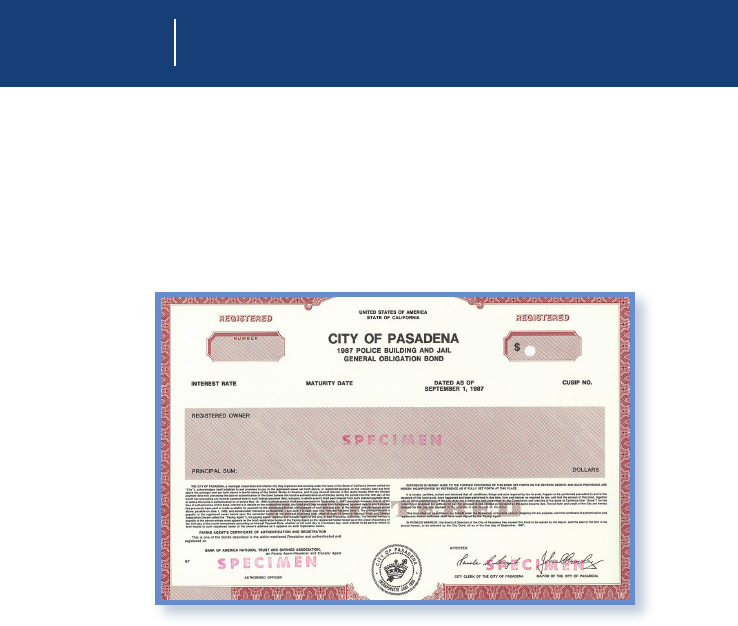
Q. What is a municipal bond?
A. A bond is a loan. ere are many types of municipal bonds, but they have
only one purpose – to borrow money. It involves a promise to pay money,
with interest, on a specied date.
SECTION 1 BONDS 101: Q&A
Q&A
Q. Who uses them?
A. e state and many local governments, especially school districts.
Q. What types of municipal bonds are there?
A. e two types most pertinent to public nance are revenue bonds and
general obligation (GO) bonds. To repay investors, revenue bonds rely on
monies derived from the sale of commodities (such as water) or from the use
of facilities (such as airports).
State general obligation bonds enjoy the “full faith and credit” of California.
“Full faith and credit” expresses the commitment of the issuer to repay the
bonds from all legally available funds. GO bonds issued by local governments,
such as schools, are often only payable from the local issuer’s property taxes.
is guide will focus on general obligation bonds. Future publications will
address other forms of government debt.
2
Q&A
Q. Do GO bonds require voter approval?
A. Yes. State GO bonds require majority voter approval. Locally issued GO bonds
require 2/3 voter approval. However, GO bonds by schools can be issued with
55% voter approval if certain statutory requirements are met.
Q. What are GO bonds used for?
A. ey are primarily used to nance infrastructure projects, including roads,
bridges, water and sewer facilities, levees, K-14 schools, public universities and
other critical public works projects.
Q. How do bonds dier from a loan?
A. e capital market has a dierent set of expectations than bank lenders have.
Primarily, these expectations relate to the certainty of repayment, a more limit-
ed tolerance for variances in nancial condition, and the size of the loan.
Also, publicly oered bonds are subject to federal securities fraud laws and
require a very high level of caution about what is disclosed and when it is dis-
closed.
Q. What is the total amount of outstanding State of California
issued GO bonds?
A. $74.9 Billion**
Q. What is the total amount of State of California GO bonds
authorized but not yet issued?
A. $27.6 Billion**
*Source: Securities Industry and Financial Markets Association
**As of June 30, 2016

Moody’s Standard & Poor’s Fitch
Current Aa3 AA- AA-
2009
Baa1* A** BBB*
3
A bond credit rating is similar to an individual’s credit score.
e better the credit rating, the cheaper the borrowing cost.
California’s credit rating has improved dramatically since the Great Recession.
On August 12, 2016, Fitch Ratings upgraded California’s GO credit rating
one notch to AA-, elevating the state to the “high grade” category.
Moody’s and S&P have maintained their Aa3 and AA- ratings respectively.
SECTION 2 THE RATINGS GAME
Moody’s Standard & Poor’s Fitch The Ratings Map
Aaa AAA AAA
High Grade
Aa1 AA+ AA+
Aa2 AA AA
Aa3 AA- AA-
A1 A+ A+
Upper Medium GradeA2 A A
A3 A- A-
Baa1 BBB+ BBB+
Lower Medium Grade
Baa2 BBB BBB
Baa3 BBB- BBB-
Ba1 BB+ BB+
Speculative Ba2 BB BB
Ba3 BB- BB-
B1 B+ B+
Highly SpeculativeB2 B B
B3 B- B-
Caa1 CCC+ CCC Substantial Risks
Caa2 CCC Extremely Speculative
Caa3 CCC-
Default
Ca CC
D DDD
DD
D
*Credit rating as of July 2009
**Credit rating as of February 2009
Investment GradeNon-Investment Grade
4
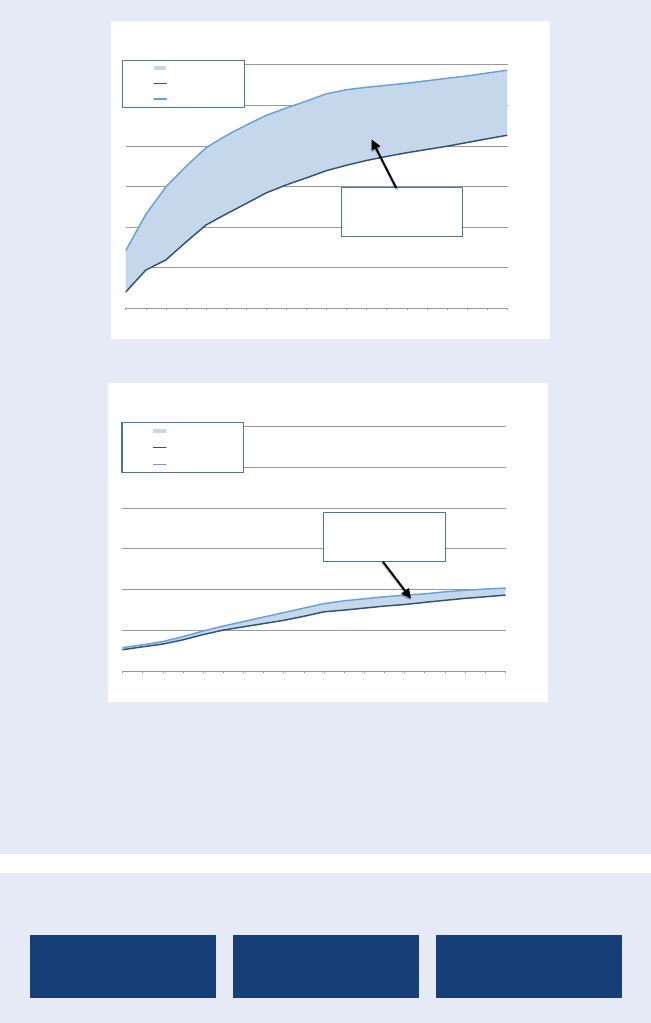
Higher credit ratings produce lower borrowing costs and taxpayer savings.
For example, the next two charts demonstrate how much taxpayers
can save when ratings go up.
Three Major Factors Rating Agencies Review When Grading
California’s Credit Worthiness
Economy
Financial Operations
and Results
Management
COST TO CA COMPARED TO AAA-RATED ISSUER:
Then - $201.6 Million • Now - $12.2 Million
Savings = $189.4 Million Per $1 Billion Borrowed
Source: Municipal Market Data as of 7/1/09
0.00%
1.00%
2.00%
3.00%
4.00%
5.00%
6.00%
1yrs 2yrs 3yrs 4yrs 5yrs 6yrs 7yrs 8yrs 9yrs 10yrs 11yrs 12yrs 13yrs 14yrs 15yrs 16yrs 17yrs 18yrs 19yrs 20yrs
InterestRate
LengthofBorrowing
COMPARING CALIFORNIA'S BORROWING COSTS TO AAA-RATED ISSUER
(as of 7/1/2009)
DIFFERENTIAL
AAA ISSUER
CALIFORNIA
For each $1.0 billion borrowed,
California would have paid $201.6
million more over a 20-year period than
a AAA-rated issuer paid.
Source: Municipal Market Data as of 7/1/16
0.00%
1.00%
2.00%
3.00%
4.00%
5.00%
6.00%
1yrs 2yrs 3yrs 4yrs 5yrs 6yrs 7yrs 8yrs 9yrs 10yrs 11yrs 12yrs 13yrs 14yrs 15yrs 16yrs 17yrs 18yrs 19yrs 20yrs
InterestRate
LengthofBorrowing
COMPARING CALIFORNIA'S BORROWING COSTS TO AAA-RATED ISSUER
(as of 7/1/2016)
DIFFERENTIAL
AAA ISSUER
CALIFORNIA
For each $1.0 billion borrowed,
California would pay $17.2 million more
over a 20-year period than a AAA-rated
issuer paid.
5
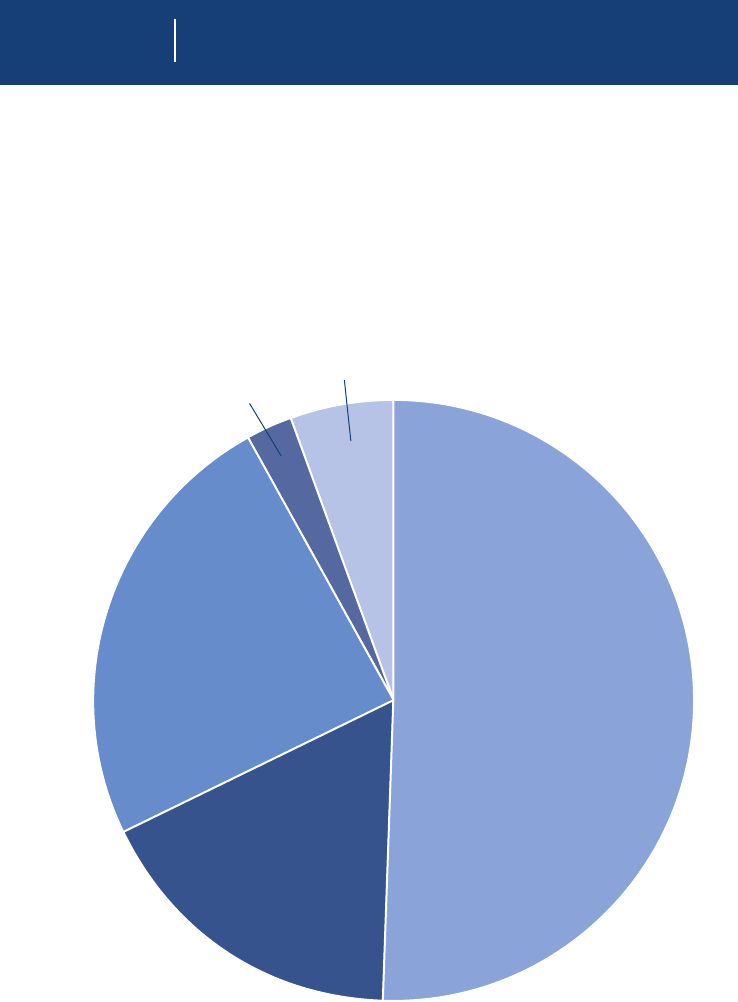
State of California’s Long-Term General Obligation Bonds Outstanding
*As of June 30, 2016
A breakdown of how proceeds of the state’s $74.9 Billion*
in outstanding long-term general obligation bonds were used:
SECTION 3 DEBT: WHAT IS IT USED FOR?
K-12 and Higher Education
$38.1 Billion
Transportation
and Clean Air
$17.9 Billion
Clean Water
and Disaster
Preparation
$13.1 Billion
Other
$4.1 Billion
Housing
$1.7 Billion
6
SECTION 4 MEASURING CALIFORNIA’S
DEBT BURDEN
Measuring California’s debt level using various ratios provides a way to
compare and understand the state’s debt burden for tax supported and general
obligation debt. ree commonly used rations are: debt as a percentage of the
state’s GDP; debt as percentage of personal income; and debt per capita.
(Figure compares what an issuer, in this
case the State of California, owes versus
what it produces. Figures as of end of
calendar year 2014.)
(Figure is based on level of debt to the
total personal income of its residents.
Personal income includes wages, business
income, interest and dividends and
governmental transfers like Social Security.)
(Figure is based on residents’ average share
of state’s total outstanding debt.)
Debt Per Capita*
Debt as Percentage
of Personal Income*
4.7%
Debt as Percentage of State GDP*
3.94%
$2,323
*Figures as reported by Moody’s in its 2016 State Debt Medians Report released May 2016.
As of end of calendar year 2014.
7
STATE MOODY’S/S&P/FITCH DEBT TO PERSONAL INCOME*
Texas Aaa/AAA/AAA 0.90%
North Carolina Aaa/AAA/AAA 1.80%
Michigan Aa1/AA-/AA 1.80%
Florida Aa1/AAA/AAA 2.50%
Pennsylvania Aa3/AA-/AA- 2.50%
Ohio Aa1/AA+/AA+ 2.60%
Georgia Aaa/AAA/AAA 2.70%
California Aa3/AA-/AA- 4.70%
Illinois Baa2/BBB+/BBB+ 5.20%
New York Aa1/AA+/AA+ 5.40%
Moody’s Median All States 2.50%
Median for the 10 Most Populous States 2.55%
STATE MOODY’S/S&P/FITCH DEBT TO CAPITA*
Texas Aaa/AAA/AAA $383
North Carolina Aaa/AAA/AAA $721
Michigan Aa1/AA-/AA $719
Georgia Aaa/AAA/AAA $1,029
Florida Aa1/AAA/AAA $1,038
Ohio Aa1/AA+/AA+ $1,091
Pennsylvania Aa3/AA-/AA- $1,172
California Aa3/AA-/AA- $2,323
Illinois Baa2/BBB+/BBB+ $2,522
New York Aa1/AA+/AA+ $3,021
Moody’s Median All States $1,025
Median for the10 Most Populous States $1,065
STATE MOODY’S/S&P/FITCH DEBT AS % OF STATE GDP*
Texas Aaa/AAA/AAA 0.64%
North Carolina Aaa/AAA/AAA 1.50%
Michigan Aa1/AA-/AA 1.59%
Ohio Aa1/AA+/AA+ 2.20%
Georgia Aaa/AAA/AAA 2.21%
Pennsylvania Aa3/AA-/AA- 2.28%
Florida Aa1/AAA/AAA 2.51%
California Aa3/AA-/AA- 3.94%
New York Aa1/AA+/AA+ 4.29%
Illinois Baa2/BBB+/BBB+ 4.41%
Moody’s Median All States 2.21%
Median for the10 Most Populous States 2.25%
*Moody’s, S&P and Fitch ratings as of August 2016.
Here’s How California Ranks Among the 10 Most Populous States
Debt to Personal IncomeDebt to Capita
Debt As % of GDP

8
*2016-17 General Fund Expenditures
SECTION 5 DEBT BURDEN COMPARED TO
BUDGETARY REVENUES & SPENDING
Other useful ways to measure debt burden is to compare it against
General Fund revenues and other budgetary spending.
Debt Service Payments
$7.7
BILLION
$51
BILLION
K-12 Education
$14
BILLION
Higher Education
$11
BILLION
Public Safety
Health and Human
Services
$33
BILLION
(Figure is based on $7.7 billion in debt
service payments versus $117 billion of
General Fund revenues in 2015-16.)
Debt Service as Percentage
of General Fund Revenues
6.54%
*
*
*
*
Debt Service Vs. Other Budgetary Spending

9
SECTION 6 CALIFORNIA REFINANCING:
HOW MUCH HAS BEEN SAVED
In Savings from Bond Refinancings Conducted
by Treasurer Chiang since January 2015*
Incoming Freshmen at University of California
Campuses for 2016-2017**
$4.2 Billion
311,111
THAT COULD PAY TUITION AND FEES FOR ONE YEAR FOR APPROXIMATELY
SAVINGS DUE TO DEBT
REFINANCINGS SINCE
JANUARY 2015
Lease
Revenue Bond
Savings -
$200 Million
Just as a homeowner can renance his or her mortgage when interest rates fall,
the Treasurer renances portions of the state debt in a similar way in order to
reduce costs to taxpayers.
*As of September 1, 2016
**Based on the average tuition and fees ($13,500) for the 2016-17 school year at UC campuses.
All other
Savings -
$1.9 billion
GO Bond
Savings:
$2.1 Billion

10
SECTION 7 CALIFORNIA’S BOND
CALENDAR
California’s general obligation bond sales generally take place three to four times
a year, generally two sales each during the respective three to four months after the
governor’s January budget release and after a budget is approved and signed in June.
California State Treasurer Chiang Sells:
$2.7
Billion in Bonds
AUGUST 2016
$1.5
Billion in Bonds
APRIL 2016
$2.9
Billion in Bonds
MARCH 2016

JOHN CHIANG | CALIFORNIA STATE TREASURER
915 Capitol Mall, Room 110
Sacramento, California 95814
(916) 653-2995
WWW.TREASURER.CA.GOV
For more information on California’s debt investment,
visit the Treasurer’s award-winning DebtWatch website
debtwatch.treasurer.ca.gov
